
2022 will not be a year investors forget (as much as many would like to). Surging inflation and a historic Fed tightening cycle left investors wondering if the pain would ever end. Not only did we enter a bear market for stocks, but bonds posted their worst year in modern history. In 45 years, the Bloomberg US Aggregate Bond Index had only posted negative returns five times. The worst year being down 2.9% in 1994. 2022 saw a 13% decline.
Why were bonds down so much one might ask… It all comes down to the fact that yields were so low, that when rates spiked up and bond prices dropped, there was not enough income to meaningfully offset the price declines over the year. The good news going forward is that rates are now near historic norms, inflation is coming down and the Fed is projected to pause rate hikes in the second quarter.
With the decline in bonds diversified portfolios suffered their worst year since 2008. At Element Wealth we track a series of investable benchmarks. The benchmarks are made up of ETFs and give us a proxy to compare diversified portfolios to. From a defensive 20% stock and 80% bond allocation to an aggressive equity allocation, the results were all negative in 2022.

What We Thought Going Into 2022
At our 2022 Economic & Market Forecast events a major theme was “Investing in a Rising Interest Rate Environment.” We advocated bringing risk levels down and incorporating inflation hedges such as direct real estate, TIPS and commodities. We believed value stocks were likely to do better than growth stocks and to focus on profitable companies with pricing power. Lastly, we encouraged investors to seek core fixed income replacements such as liquid alternatives and certain insurance products with principal guarantees.
What Actually Happened in 2022
Since the financial crisis, growth stocks benefited from excessively low interest rates and easy money policies from the Federal Reserve. With inflation surpassing the markets expectations (and ours) and not breaking until later in the year, growth stocks dramatically underperformed value stocks.
Growth Stocks vs Value Stocks in 2022
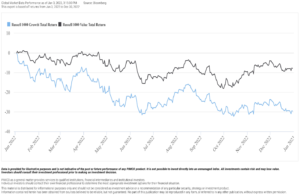
Chart courtesy of PIMCO
From a sector perspective, energy was the big winner in 2022 as oil prices surged. Defensive sectors such as utilities, health care, and consumer staples held up reasonably well. Sectors that suffered the worst in 2022 were information technology, consumer discretionary, and communication services.
S&P 500 Sectors in 2022
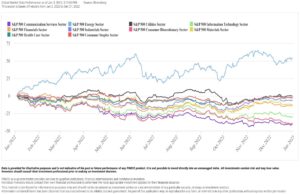
Chart courtesy of PIMCO
Rising rates didn’t just hurt US large cap stocks. Small cap stocks and international stocks were not immune to the bear market. However, despite the war in Ukraine and a strong dollar, international stocks fared slightly better than US stocks.
Large Cap vs Small Cap vs International in 2022
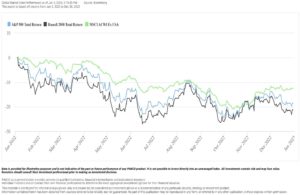
Chart courtesy of PIMCO
In the bond market, long-term bonds were hit the hardest. As a reminder, bond prices are inversely correlated to changes in interest rates, and the longer the term of a bond the more sensitive it will be to the changes in interest rates. Municipal bonds held up better than taxable bonds and high yield outperformed investment grade credit.
Bond Indices in 2022
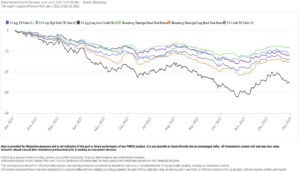
Chart courtesy of PIMCO
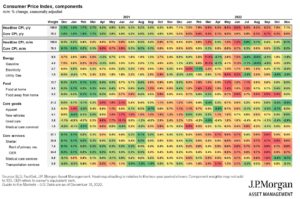
Inflation
In 2021 inflationary pressures started to mount. They continued throughout 2022, peaking in June with headline CPI at 9.0% year-over-year. The latest reading from November shows 7.1%. The inflation picture continues to get better. Energy costs have generally been declining since the summer and core goods (apparel, vehicles, and medical care) declined in October and November, led by a correction in used car prices. Food prices continue to increase, but at a slower rate, while shelter costs remain hot. It should be noted that there tends to be a lag effect in the way housing inflation is calculated. With mortgage rates up and the housing market slowing, we believe it will be reflected in the inflation readings in coming months.
Inflation Heat Map
The Economy
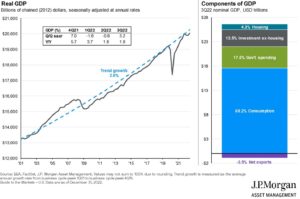
2022 showed that the assumed definition of a recession, two consecutive quarters of declining real GDP, was not exactly true. In the first half of the year we had two quarters of negative GDP but the National Bureau of Economic Research (NBER) did not declare a recession. The NBER defines a recession as “a significant decline in economic activity spread across the economy, lasting more than a few months, normally visible in real GDP, real income, employment, industrial production, and wholesale-retail sales.” The definition is a lot to digest but our public view on why we weren’t in a recession was that the unemployment rate was below 4%, corporate profits were increasing and nominal GDP was rising at a double digit rate. The real GDP numbers were negative because inflation was so high but 3.2% growth in the third quarter put things back on track for a minimal economic gain in 2022.
Economic Growth and the Composition of GDP
Looking Forward
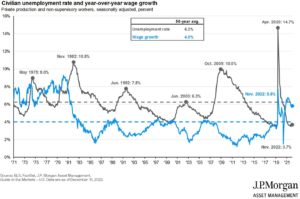
As we begin 2023 we must first note that the bear market in stocks has not ended. The economy is teetering on the edge of a recession. The personal savings rate has fallen to 2.3%, credit card balances are rising, and mortgage rates have doubled. Wage growth is slowing and the chart below indicates that as wage growth slows, the unemployment rate goes up. With this backdrop we place a 75% probability that the US goes into a recession in 2023.
Unemployment and Wages
Our view of a likely recession in 2023 is pretty consensus, so we believe that a recession is partially priced into the stock market already. If or when it comes, the next recession will be the most anticipated in history.
Fortunately, with interest rates back to reasonable levels, diversified portfolios should begin to act like normal in 2023. Historically, bonds provide income and ballast in a portfolio. When recessions hit or stocks go into a bear market, interest rates tend to drop, and high-quality bonds appreciate. This did not happen in 2022 because the Fed ripped the Band-Aid off and rates soared, thus forcing stock valuations down. Both stocks and bonds suffered.
United States 10-Year Treasury Rate and Fed Funds Target
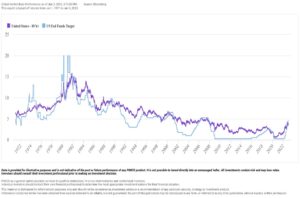
Chart courtesy of PIMCO
Looking forward, the relationship between stocks and bonds appears much more normal. So instead of panicking and running for the door with the potential of a recession, we suggest investors do an analysis of what they own, their time horizon, and develop a plan. The thing people always forget about when they bail out of the market, is that you must be right twice. You must get out at the right time, but you also must get back in at the right time, and that is easier said than done.
For a full preview of our 2023 outlook and recommendations, join us a one of our four Economic & Market Forecasts.
Madison, MS After Hours – Tuesday, January 17th – 5:30 PM to 7:30 PM – Georgia Blue
Jackson, MS Luncheon – Thursday, January 19th – 11:30 AM – 1:00 PM – Country Club of Jackson
Mobile, AL After Hours – Tuesday, January 24th – 5:30 PM to 7:30 PM – Country Club of Mobile
Biloxi, MS After Hours – Wednesday, January 25th – 5:30 PM to 7:30 PM – Patio 44
On behalf of the entire team at Element Wealth, we wish you a happy and prosperous 2023!
Sincerely,
Jeremy Nelson, Partner
Element Wealth, LLC (EW) is an investment adviser registered with the Securities and Exchange Commission (SEC). EW only transacts business in states where it is registered, or where an exemption from registration is available. Registration as an investment adviser does not constitute an endorsement of the firm by the SEC, nor does it indicate a particular level of skill or ability. Past performance is not indicative of future results, and investors should realize that investing in securities involves risk of loss. Money invested in securities is not guaranteed against such loss by any governmental or non-governmental organization. EW is not a law or accounting firm, and does not give legal, accounting or tax advice.