
My morning routine consists of waking up, grabbing my phone, and opening the CNBC app to see what is happening in the futures markets. Futures on the S&P 500 and various other indices give us an indication of where markets will open. I also check what’s happening in various overseas markets, fixed income markets, and yes… I must see where Bitcoin and other cryptocurrencies are trading! I then go for a run, get ready for work, and drop my oldest son off at school. Once I get to the office, I turn on my computer and the first thing I do is open CNBC.com to see if there have been any changes in the futures markets. Today, I saw a particularly interesting headline. Legendary investor Jeremy Grantham of Grantham, Mayo, & van Otterloo (GMO) says U.S. stocks are in a ‘magnificent bubble,’ crazier than 1929 and 2000.
In June 2020, Grantham went on CNBC and said we are in the “Real McCoy” of bubbles. To his credit, he did say they can go on for a while and was not calling a top. But when questioned this time, he believed that we are nearing the end. He said that the bubble is across stocks, bonds, and real estate. In stocks, he said that the bubble is not as bad as Japan in 1989, but that in the U.S., conditions are even crazier than speculative periods before the crashes in 1929 and 2000. Excluding the U.S., he believes stocks are only moderately overpriced and that they would still produce a positive return over the next 10 years.
Regarding U.S. stocks, one of his main points was that the high growth stocks began to rollover in February. Higher beta small cap stocks have been flat, while blue chip stocks have been continuing higher. He stated that in 2000, the exact same thing happened. The growth stocks, led by tech began to peel off and by September were down 50%, yet the S&P 500 was flat. The same thing happened in 1929, as the “flaky” stocks were going down all year as the market went up a final 40%.
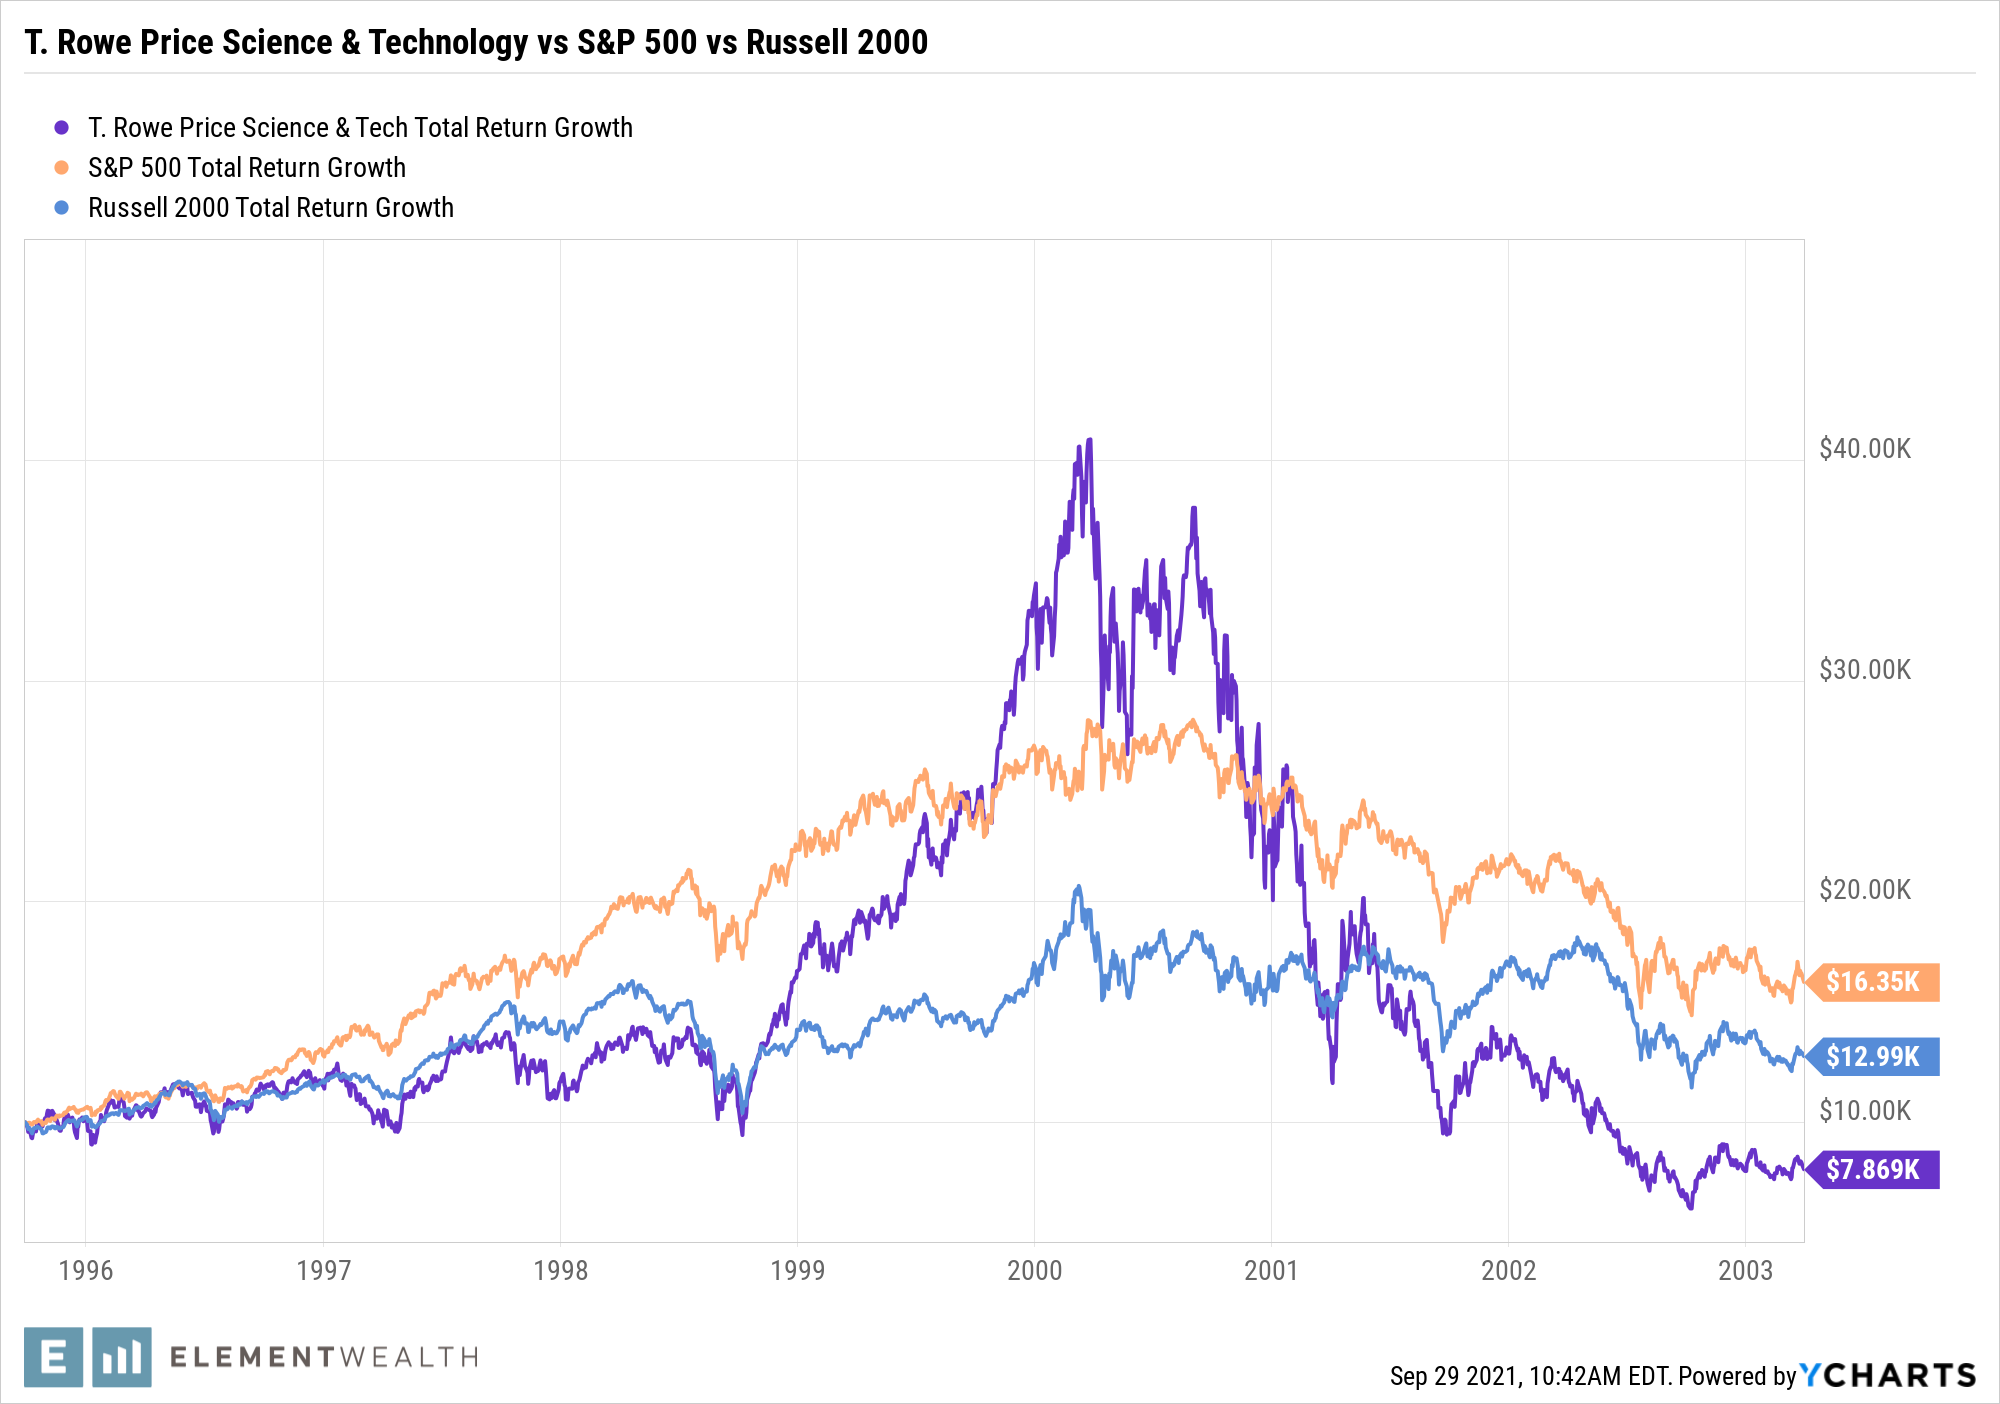
Data is hard to come by from 1929, but we have lots from 2000. Below is a chart of the T. Rowe Price Science and Technology Fund, compared to the S&P 500 and Russell 2000 (small cap stock index). You can see that through the last phase of the big secular bull market that began in 1982, blue chip stocks represented by the S&P 500 dramatically outperformed small cap stocks. Then we saw an exposition in the T. Rowe Price Science and Technology Fund before a collapse. Small cap stocks turned down around the same time and it took a few months before the S&P 500 followed.
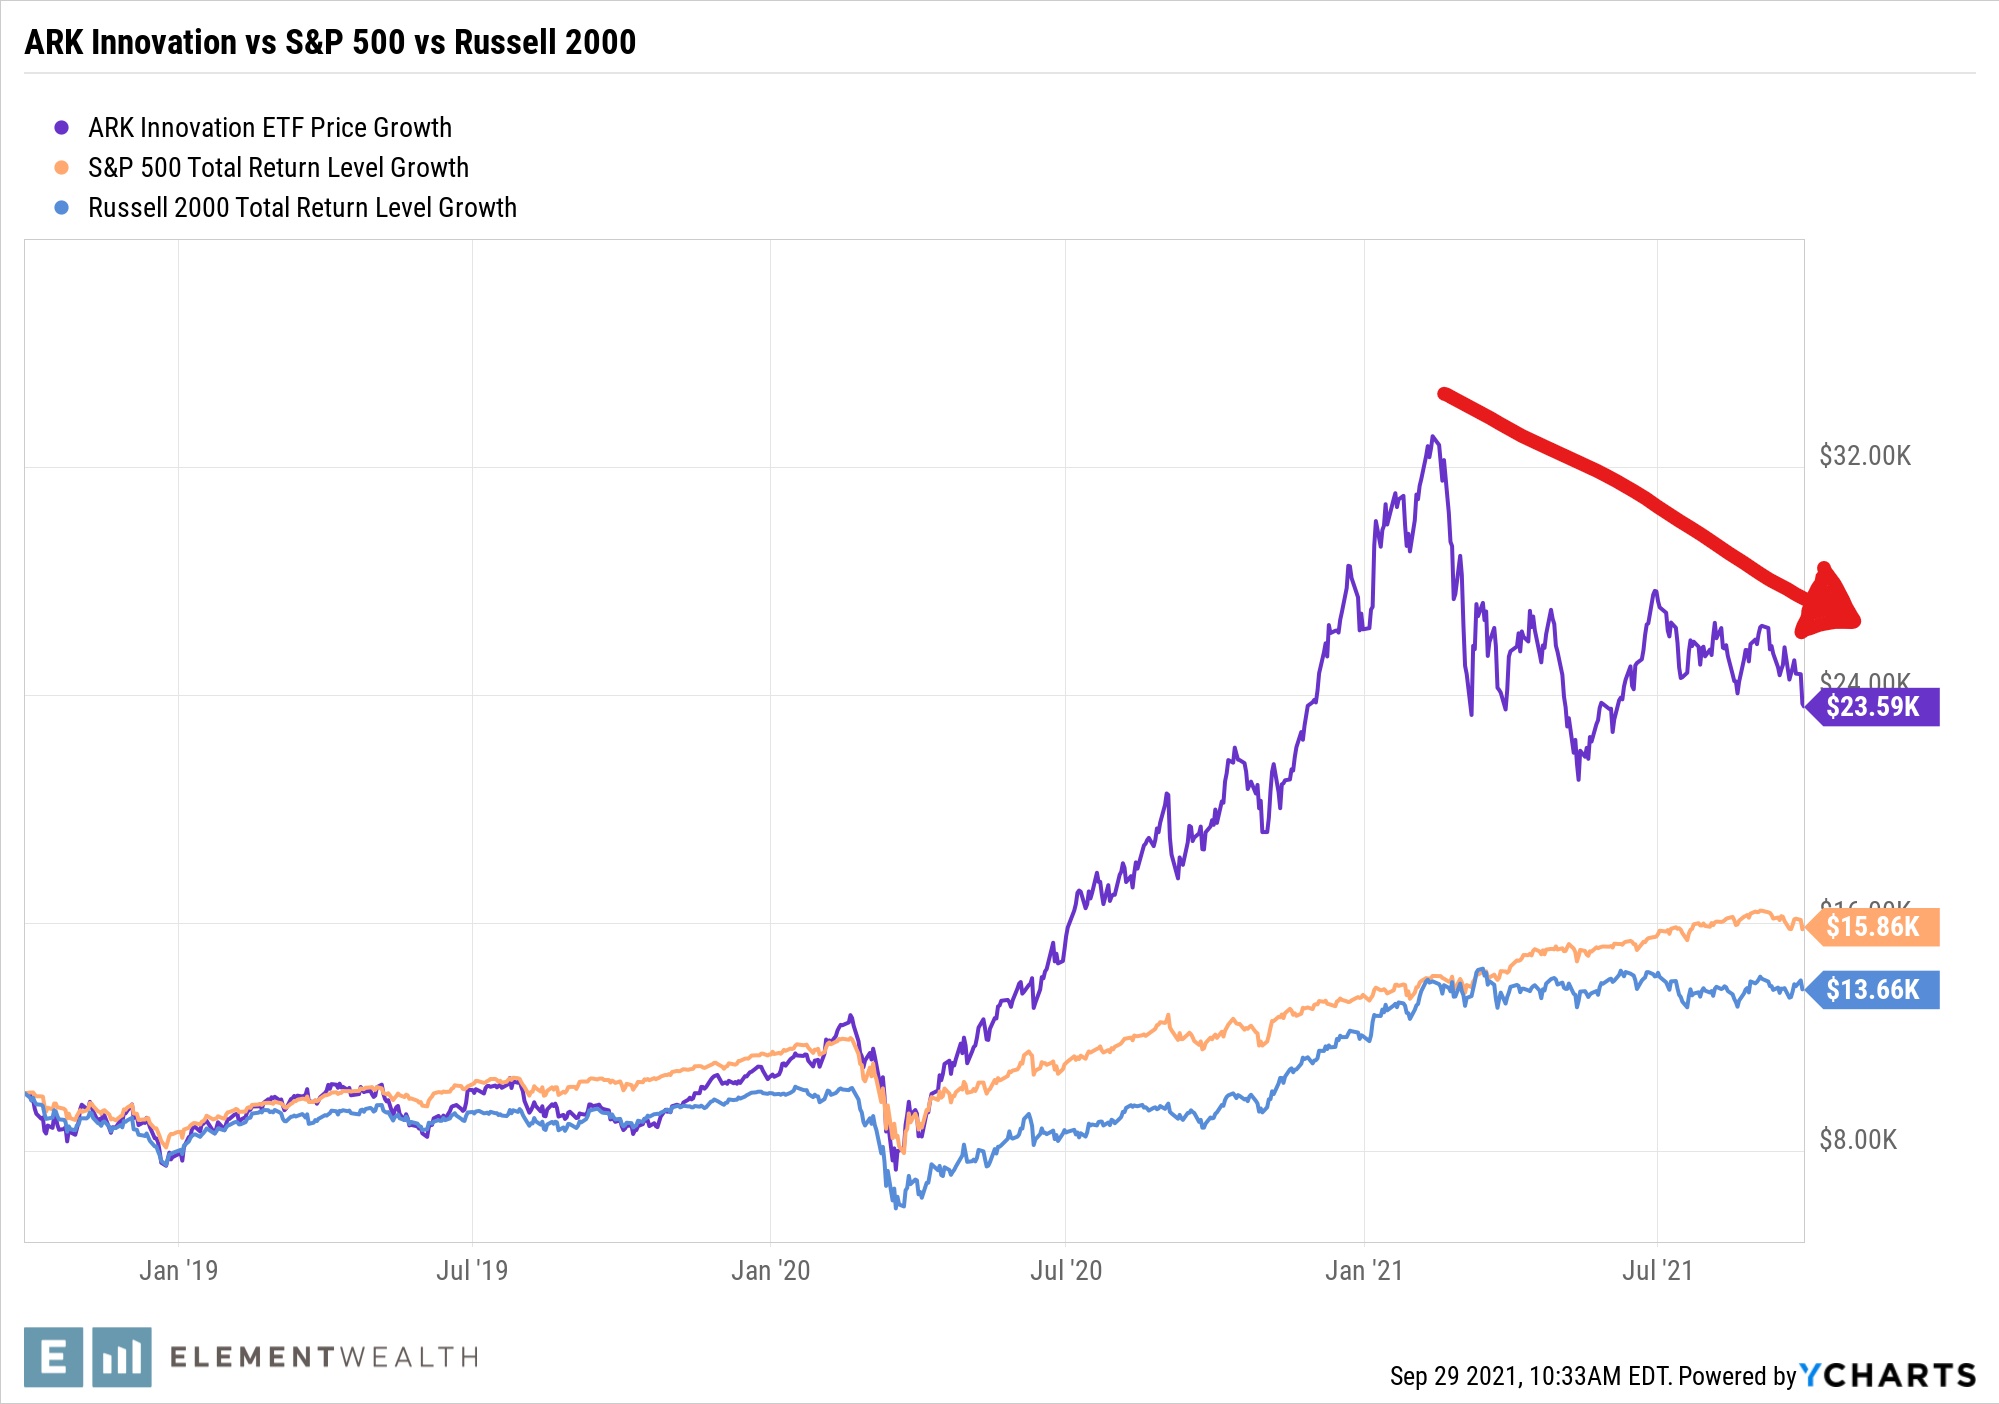
Looking at today, I have used Kathy Wood’s Ark Innovation ETF instead of the T. Rowe Price Science & Technology Fund. At the end of 2019, this ETF, which focuses on some of the highest growth opportunities, had just under $1.9 billion in assets under management (AUM). Throughout the pandemic, investors flocked to the fund, and at its’ peak in February of this year it had just under $28 billion in AUM.
The chart below describes a similar picture to the previous one. After tracking closely since the end of the financial crisis, blue chip stocks (S&P 500) began to materially outperform small cap stocks (Russell 2000) in 2019. During the pandemic, high growth speculative stocks exploded to the upside, while small cap stocks lagged the S&P 500. Beginning in February of this year, blue chip stocks continued to chug higher, while speculative stocks have begun to fall, and small cap stocks have flatlined.
What will happen next, only time will tell, but I must admit that I have seen some strange investor behavior over the past year and a half. Just this weekend I had a parent from my child’s class explain to me that he now has his GameStop shares directly registered and not in street name with a broker. His point is that short sellers can’t borrow the shares now. I stated that the company was still losing money. He told me I was wrong. I checked and over the trailing twelve months as of July 2021, they had lost $0.92 per share, which, admittedly, is better than previous periods. But revenues are still down 13.6% from pre-pandemic levels, 28.7% from two years ago, and 31% from three years ago. I suppose the point is that to him, there is nothing I can say that will change his mind that this stock that went from $6.08 at the end of 2019 to $178.50 today is not overvalued. But to each their own!
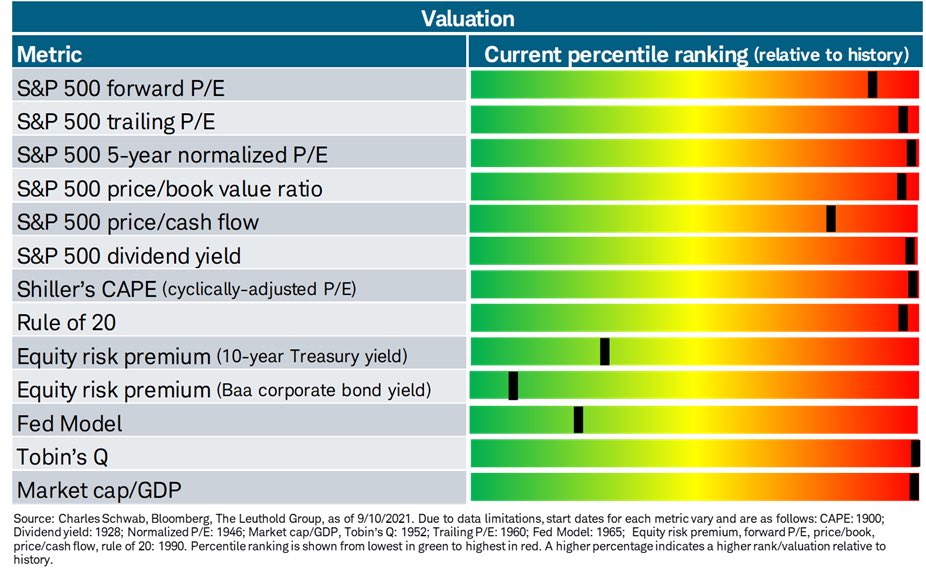
Grantham raises many valid points and has a strong historical perspective. To show a contrasting view, here is a tweet from Liz Ann Sonders, Chief Investment Strategist at Charles Schwab. The chart below shows that, while yes, every market metric is expensive relative to history, they are not cheap relative to where yields or interest rates are.
 To better understand this, you must know that just like housing prices, valuations on stocks tend to go up when interest rates go down. There are three primary reasons for this:
- “TINA” – There Is No Alternative – If investors can’t get a return on safe investments, they will flock to riskier assets to meet their return objectives.
- Math – when valuing companies, the lower the cost of capital, the more you will pay for future cash flows. In general, companies are funded with equity and debt. When rates go down, debt is cheaper, but it makes equity cheaper as well. The reason is that because the cost of equity is a function of the risk-free rate (generally 10-year treasury), the risk of the business, and the equity risk premium (how much we demand in additional return to own stocks over a risk-free asset). If the cost of capital is reduced, we discount future cash flows less, and thus pay more for companies. Although not the same, think about buying a house. If you can afford a mortgage payment of $3,000 a month and you get a lower rate, more money will go to principal, thus you can afford a more expensive home. If more people can afford a more expensive home, housing prices go up.
- “FOMO” – Fear Of Missing Out – At the end of a market cycle, investors who have been on the sidelines, or new investors, see everyone else making money and end up jumping in.
As of today, our firm view is that the market trend is still mildly positive. However, that could change rapidly. In the 1950s and early 1960s, interest rates rose but the economy was good, and equities moved higher. But in the mid-1960s things hit a breaking point, stocks turned, we had a couple of recessions in the early 1970s, and equities ultimately had a tough 16 years. Following the financial crisis, the Fed began raising rates at the end of 2015. Stocks held on until the ‘Taper Tantrum’ in 2018.
As we look ahead, much will depend on the rate of change in interest rates and whether the Fed ‘surprises’ the markets. But investors, and specifically those nearing or entering retirement, should be aware of the historic perspective that Grantham has expressed and develop a plan that would prepare themselves for a change in the market environment.
E-mail Public@MyElementWealth.com with any questions and we’ll be glad to respond.
Jeremy Nelson, Partner